
Decoy Management
The console your SOC already understands: a quiet dashboard, one enriched alert when a decoy is touched, and a designer that plants traps against ATT&CK — not a new tool to babysit.
One pane for the whole fabric.
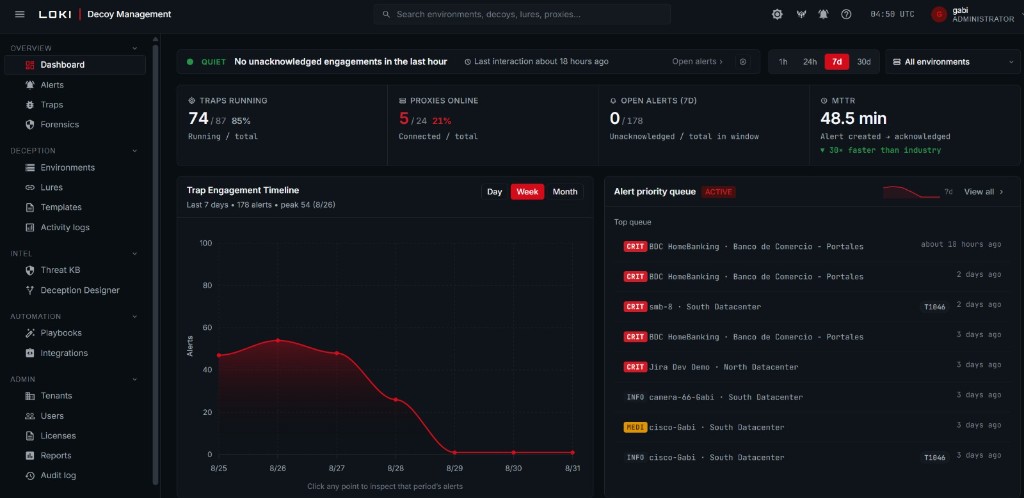
The dashboard is built for a quiet SOC. If nothing is touching a decoy, the board stays quiet. When something is wrong, the numbers, the timeline, and the queue move together.
- 01Quiet until it is not
The status strip reports posture in one line — no unacknowledged engagements means nobody is babysitting a console.
- 02Fleet at a glance
Traps running, proxies online, open alerts, and MTTR sit in the same row so operators see coverage and lag without hunting menus.
- 03Engagement timeline
The week view plots trap hits over time. Click a point to inspect that period instead of paging through a raw log.
- 04Priority queue
CRIT, MEDI, and INFO land in one list with MITRE tags attached — the same enrichment that streams into your SIEM.
One enriched hit — not a thousand maybes.
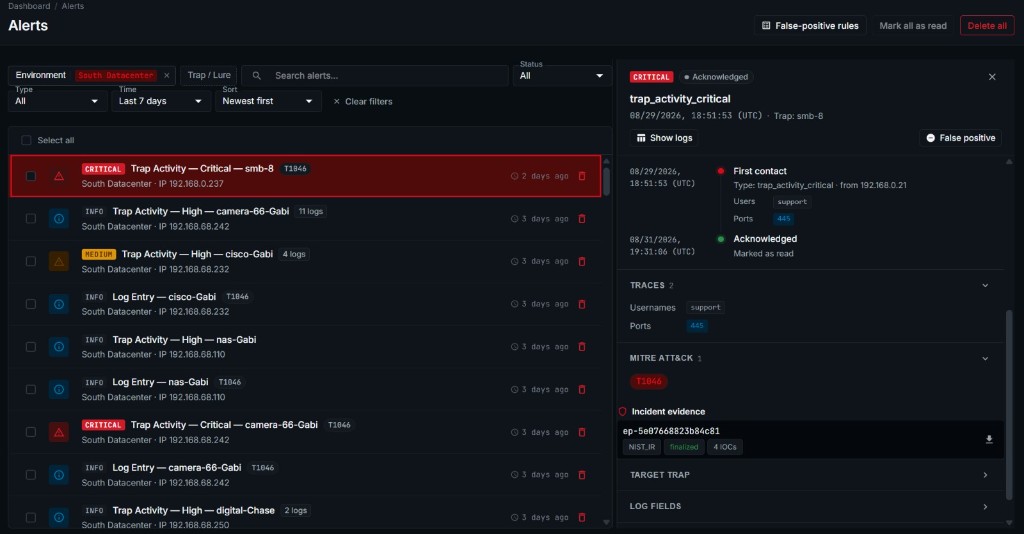
When an attacker touches a decoy, the console opens the same object your SIEM receives: first contact, traces, ATT&CK, and evidence, without a new tool to learn.
- 01Filter, then inspect
Environment, status, type, and time sit above the list. Select a row and the detail pane stays on the same screen.
- 02Timeline of the touch
First contact records source IP, users, and ports. Acknowledgement is a second beat — who saw it, and when.
- 03Traces and ATT&CK
Usernames, ports, and technique IDs (T1046 and the rest) travel with the alert so the SOC can act without a second lookup.
- 04Evidence, not noise
Incident packs, IOCs, and trap context are attached to the event. False-positive rules live one click away.
Plan coverage on ATT&CK — then plant.
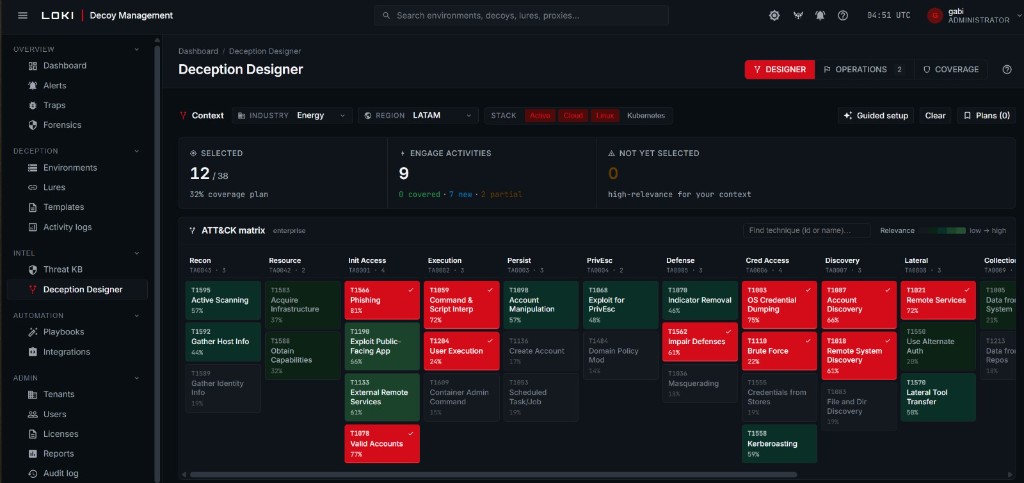
Deception Designer is how you decide what to deploy. Pick industry, region, and stack. The matrix shows which techniques you already cover and where the next decoy should land.
- 01Context first
Industry, region, and stack (Active Directory, cloud, Linux, Kubernetes) scope the plan so you are not planting generic traps.
- 02ATT&CK as the board
Each cell is a technique with a coverage score. Green is covered. Red is high-relevance and still open. Grey can wait.
- 03Guided setup
Selected vs remaining counts sit above the matrix. Guided setup turns a coverage gap into a decoy, lure, or environment in the fabric.
- 04From plan to mesh
What you mark here becomes decoys, lures, and breadcrumbs — the same assets the dashboard watches and the SIEM already knows.
Three engines under one control plane.
Decoys
Network of trap systems replicating real services. Scale virtual assets across 50+ services with topology mapping, fingerprinting, and threat correlation.
Code traps
Code-level traps that embed crafted lures into application code, with real-time monitoring and forensic analysis.
Lures & breadcrumbs
Tokenized objects with AI-generated content that catch attackers across files, credentials, and paths — with geolocation and user attribution.
Ready to plant the mesh?
Talk to our team about how Decoy Management lands in your SOC — dashboard, alerts, and designer included.